BMI Chart
This BMI chart gives the body mass index for adult heights from 4 ft 10 in to 6 ft 4 in and weights from 100 to 250 pounds, with a metric version below. A healthy BMI for adults is 18.5 to 24.9.
Sources: WHO, CDC, NIH Updated
BMI categories for adults
- UnderweightBMI below 18.5
- Healthy weightBMI 18.5 to 24.9
- OverweightBMI 25.0 to 29.9
- ObesityBMI 30.0 or above
The cut-offs are the ones published by the World Health Organization, CDC and the National Heart, Lung, and Blood Institute. They apply to adults aged 20 and over.
BMI chart in pounds, feet and inches
Each cell is 703 × weight ÷ height², rounded to one decimal. Scroll sideways on a small screen; the height column stays in place.
| Height | 100 lb | 110 lb | 120 lb | 130 lb | 140 lb | 150 lb | 160 lb | 170 lb | 180 lb | 190 lb | 200 lb | 210 lb | 220 lb | 230 lb | 240 lb | 250 lb |
|---|---|---|---|---|---|---|---|---|---|---|---|---|---|---|---|---|
| 4′ 10″ | 20.9 | 23.0 | 25.1 | 27.2 | 29.3 | 31.3 | 33.4 | 35.5 | 37.6 | 39.7 | 41.8 | 43.9 | 46.0 | 48.1 | 50.2 | 52.2 |
| 4′ 11″ | 20.2 | 22.2 | 24.2 | 26.3 | 28.3 | 30.3 | 32.3 | 34.3 | 36.4 | 38.4 | 40.4 | 42.4 | 44.4 | 46.4 | 48.5 | 50.5 |
| 5′ 0″ | 19.5 | 21.5 | 23.4 | 25.4 | 27.3 | 29.3 | 31.2 | 33.2 | 35.2 | 37.1 | 39.1 | 41.0 | 43.0 | 44.9 | 46.9 | 48.8 |
| 5′ 1″ | 18.9 | 20.8 | 22.7 | 24.6 | 26.4 | 28.3 | 30.2 | 32.1 | 34.0 | 35.9 | 37.8 | 39.7 | 41.6 | 43.5 | 45.3 | 47.2 |
| 5′ 2″ | 18.3 | 20.1 | 21.9 | 23.8 | 25.6 | 27.4 | 29.3 | 31.1 | 32.9 | 34.7 | 36.6 | 38.4 | 40.2 | 42.1 | 43.9 | 45.7 |
| 5′ 3″ | 17.7 | 19.5 | 21.3 | 23.0 | 24.8 | 26.6 | 28.3 | 30.1 | 31.9 | 33.7 | 35.4 | 37.2 | 39.0 | 40.7 | 42.5 | 44.3 |
| 5′ 4″ | 17.2 | 18.9 | 20.6 | 22.3 | 24.0 | 25.7 | 27.5 | 29.2 | 30.9 | 32.6 | 34.3 | 36.0 | 37.8 | 39.5 | 41.2 | 42.9 |
| 5′ 5″ | 16.6 | 18.3 | 20.0 | 21.6 | 23.3 | 25.0 | 26.6 | 28.3 | 30.0 | 31.6 | 33.3 | 34.9 | 36.6 | 38.3 | 39.9 | 41.6 |
| 5′ 6″ | 16.1 | 17.8 | 19.4 | 21.0 | 22.6 | 24.2 | 25.8 | 27.4 | 29.0 | 30.7 | 32.3 | 33.9 | 35.5 | 37.1 | 38.7 | 40.3 |
| 5′ 7″ | 15.7 | 17.2 | 18.8 | 20.4 | 21.9 | 23.5 | 25.1 | 26.6 | 28.2 | 29.8 | 31.3 | 32.9 | 34.5 | 36.0 | 37.6 | 39.2 |
| 5′ 8″ | 15.2 | 16.7 | 18.2 | 19.8 | 21.3 | 22.8 | 24.3 | 25.8 | 27.4 | 28.9 | 30.4 | 31.9 | 33.4 | 35.0 | 36.5 | 38.0 |
| 5′ 9″ | 14.8 | 16.2 | 17.7 | 19.2 | 20.7 | 22.1 | 23.6 | 25.1 | 26.6 | 28.1 | 29.5 | 31.0 | 32.5 | 34.0 | 35.4 | 36.9 |
| 5′ 10″ | 14.3 | 15.8 | 17.2 | 18.7 | 20.1 | 21.5 | 23.0 | 24.4 | 25.8 | 27.3 | 28.7 | 30.1 | 31.6 | 33.0 | 34.4 | 35.9 |
| 5′ 11″ | 13.9 | 15.3 | 16.7 | 18.1 | 19.5 | 20.9 | 22.3 | 23.7 | 25.1 | 26.5 | 27.9 | 29.3 | 30.7 | 32.1 | 33.5 | 34.9 |
| 6′ 0″ | 13.6 | 14.9 | 16.3 | 17.6 | 19.0 | 20.3 | 21.7 | 23.1 | 24.4 | 25.8 | 27.1 | 28.5 | 29.8 | 31.2 | 32.5 | 33.9 |
| 6′ 1″ | 13.2 | 14.5 | 15.8 | 17.1 | 18.5 | 19.8 | 21.1 | 22.4 | 23.7 | 25.1 | 26.4 | 27.7 | 29.0 | 30.3 | 31.7 | 33.0 |
| 6′ 2″ | 12.8 | 14.1 | 15.4 | 16.7 | 18.0 | 19.3 | 20.5 | 21.8 | 23.1 | 24.4 | 25.7 | 27.0 | 28.2 | 29.5 | 30.8 | 32.1 |
| 6′ 3″ | 12.5 | 13.7 | 15.0 | 16.2 | 17.5 | 18.7 | 20.0 | 21.2 | 22.5 | 23.7 | 25.0 | 26.2 | 27.5 | 28.7 | 30.0 | 31.2 |
| 6′ 4″ | 12.2 | 13.4 | 14.6 | 15.8 | 17.0 | 18.3 | 19.5 | 20.7 | 21.9 | 23.1 | 24.3 | 25.6 | 26.8 | 28.0 | 29.2 | 30.4 |
- Underweight: below 18.5
- Healthy weight: 18.5 to 24.9
- Overweight: 25.0 to 29.9
- Obesity: 30.0 or above
BMI chart in kilograms and centimetres
| Height | 45 kg | 50 kg | 55 kg | 60 kg | 65 kg | 70 kg | 75 kg | 80 kg | 85 kg | 90 kg | 95 kg | 100 kg | 105 kg | 110 kg | 115 kg | 120 kg |
|---|---|---|---|---|---|---|---|---|---|---|---|---|---|---|---|---|
| 150 cm | 20.0 | 22.2 | 24.4 | 26.7 | 28.9 | 31.1 | 33.3 | 35.6 | 37.8 | 40.0 | 42.2 | 44.4 | 46.7 | 48.9 | 51.1 | 53.3 |
| 155 cm | 18.7 | 20.8 | 22.9 | 25.0 | 27.1 | 29.1 | 31.2 | 33.3 | 35.4 | 37.5 | 39.5 | 41.6 | 43.7 | 45.8 | 47.9 | 49.9 |
| 160 cm | 17.6 | 19.5 | 21.5 | 23.4 | 25.4 | 27.3 | 29.3 | 31.2 | 33.2 | 35.2 | 37.1 | 39.1 | 41.0 | 43.0 | 44.9 | 46.9 |
| 165 cm | 16.5 | 18.4 | 20.2 | 22.0 | 23.9 | 25.7 | 27.5 | 29.4 | 31.2 | 33.1 | 34.9 | 36.7 | 38.6 | 40.4 | 42.2 | 44.1 |
| 170 cm | 15.6 | 17.3 | 19.0 | 20.8 | 22.5 | 24.2 | 26.0 | 27.7 | 29.4 | 31.1 | 32.9 | 34.6 | 36.3 | 38.1 | 39.8 | 41.5 |
| 175 cm | 14.7 | 16.3 | 18.0 | 19.6 | 21.2 | 22.9 | 24.5 | 26.1 | 27.8 | 29.4 | 31.0 | 32.7 | 34.3 | 35.9 | 37.6 | 39.2 |
| 180 cm | 13.9 | 15.4 | 17.0 | 18.5 | 20.1 | 21.6 | 23.1 | 24.7 | 26.2 | 27.8 | 29.3 | 30.9 | 32.4 | 34.0 | 35.5 | 37.0 |
| 185 cm | 13.1 | 14.6 | 16.1 | 17.5 | 19.0 | 20.5 | 21.9 | 23.4 | 24.8 | 26.3 | 27.8 | 29.2 | 30.7 | 32.1 | 33.6 | 35.1 |
| 190 cm | 12.5 | 13.9 | 15.2 | 16.6 | 18.0 | 19.4 | 20.8 | 22.2 | 23.5 | 24.9 | 26.3 | 27.7 | 29.1 | 30.5 | 31.9 | 33.2 |
| 195 cm | 11.8 | 13.1 | 14.5 | 15.8 | 17.1 | 18.4 | 19.7 | 21.0 | 22.4 | 23.7 | 25.0 | 26.3 | 27.6 | 28.9 | 30.2 | 31.6 |
- Underweight: below 18.5
- Healthy weight: 18.5 to 24.9
- Overweight: 25.0 to 29.9
- Obesity: 30.0 or above
Your exact height or weight is between two rows or columns? The calculator below works it out for you, and the BMI calculator page explains the formula step by step.
Calculate your own BMI
Your BMI
23.6
Healthy weight BMI 18.5 to 24.9
Healthy weight for your height: 125–168 lb
Your weight is within this range. A BMI of 18.5 to 24.9 is in the healthy weight range for adults.
The numbers above are an example. Change them to see your own result.
A shared link contains the numbers entered here.
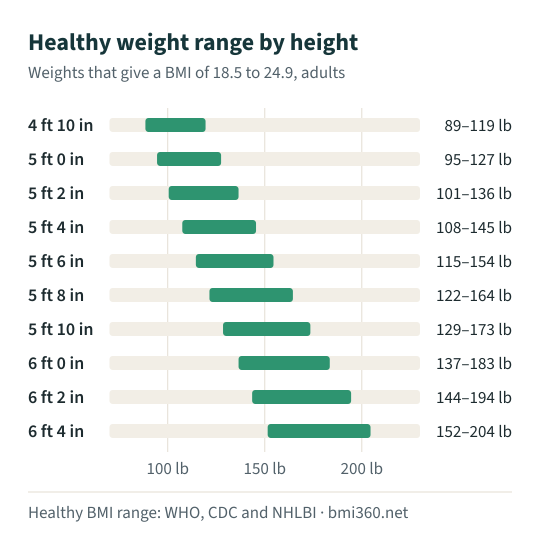
Healthy weight range by height
The weights that give a BMI of 18.5 to 24.9 at each height, in whole pounds and tenths of a kilogram. For the weight at any other BMI, use the reverse BMI calculator.
| Height | In cm | Healthy weight (lb) | Healthy weight (kg) |
|---|---|---|---|
| 4′ 10″ | 147 cm | 89–119 lb | 40.1–54.1 kg |
| 4′ 11″ | 150 cm | 92–123 lb | 41.5–56.0 kg |
| 5′ 0″ | 152 cm | 95–127 lb | 42.9–57.9 kg |
| 5′ 1″ | 155 cm | 98–132 lb | 44.3–59.8 kg |
| 5′ 2″ | 157 cm | 101–136 lb | 45.8–61.8 kg |
| 5′ 3″ | 160 cm | 105–140 lb | 47.3–63.8 kg |
| 5′ 4″ | 163 cm | 108–145 lb | 48.8–65.9 kg |
| 5′ 5″ | 165 cm | 111–149 lb | 50.3–68.0 kg |
| 5′ 6″ | 168 cm | 115–154 lb | 51.9–70.1 kg |
| 5′ 7″ | 170 cm | 118–159 lb | 53.5–72.2 kg |
| 5′ 8″ | 173 cm | 122–164 lb | 55.1–74.4 kg |
| 5′ 9″ | 175 cm | 125–168 lb | 56.7–76.6 kg |
| 5′ 10″ | 178 cm | 129–173 lb | 58.4–78.8 kg |
| 5′ 11″ | 180 cm | 133–178 lb | 60.1–81.1 kg |
| 6′ 0″ | 183 cm | 137–183 lb | 61.8–83.4 kg |
| 6′ 1″ | 185 cm | 140–189 lb | 63.5–85.7 kg |
| 6′ 2″ | 188 cm | 144–194 lb | 65.2–88.1 kg |
| 6′ 3″ | 191 cm | 148–199 lb | 67.0–90.5 kg |
| 6′ 4″ | 193 cm | 152–204 lb | 68.8–92.9 kg |
| 6′ 5″ | 196 cm | 156–210 lb | 70.6–95.4 kg |
| 6′ 6″ | 198 cm | 160–215 lb | 72.5–97.9 kg |
How to read a BMI chart
- Measure your height without shoes and your weight in light clothing.
- Find the row for your height and the column closest to your weight.
- Read the number and match the cell colour to the key under the chart.
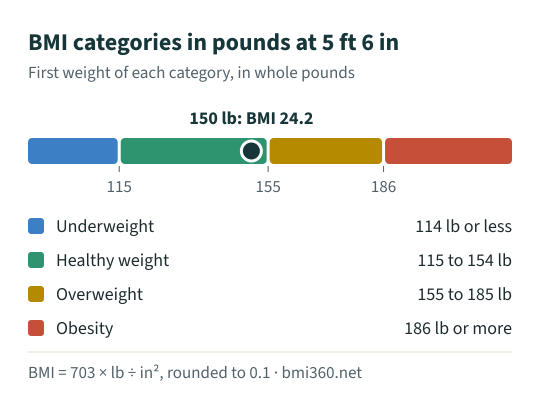
Example: 5 feet 6 inches and 150 pounds meet at a BMI of 24.2, in the healthy weight range. The healthy range for that height is 115–154 lb.
Is the BMI chart different for women, men and older adults?
There is one chart for adults. The formula uses only height and weight, and CDC applies the same categories to all adults aged 20 and over, whatever their age or sex.
Some guidance adds nuance. The UK's NICE guideline uses lower thresholds for people with a South Asian, Chinese, other Asian, Middle Eastern, Black African or African-Caribbean background (overweight from a BMI of 23, obesity from 27.5), and advises caution when reading BMI in people aged 65 and over and in people with a lot of muscle.
BMI chart for children and teens
This chart is not for anyone under 20. A child's BMI is compared with children of the same age and sex on the CDC growth charts, and the result is a percentile: the 5th to below the 85th percentile is the healthy weight range. The kids BMI calculator does this and shows the result on a growth curve.
What a BMI chart does not show
BMI is a screening measure. It cannot tell fat from muscle and bone, and it does not show where fat sits, so two people in the same cell can have very different bodies.
CDC says BMI should be considered together with other factors when a person's health is assessed. A waist-to-height ratio adds information about fat around the middle, and the ideal weight calculator explains why a range is a better guide than one target weight.
Questions about the BMI chart
What is the normal BMI range?
18.5 to 24.9 for adults aged 20 and over. WHO calls this range normal weight; CDC and the U.S. National Institutes of Health call it healthy weight. The cut-offs are the same in all three.
Is there a separate BMI chart for women and for men?
No. For adults the chart and the categories are the same for women and men. CDC applies the adult categories regardless of age, sex or race.
What is a healthy weight for my height?
The weights that give a BMI of 18.5 to 24.9. For example: 101–136 lb at 5 ft 2 in, 115–154 lb at 5 ft 6 in, 129–173 lb at 5 ft 10 in and 144–194 lb at 6 ft 2 in. The table on this page lists every height.
Can I use this chart for a child?
No. Children and teens aged 2 to 19 are compared with others of the same age and sex, so their result is a percentile. Use the kids BMI calculator.
What is a healthy BMI by age?
For adults the healthy range does not change with age: it is 18.5 to 24.9 from age 20, whatever your age or sex. The UK's NICE guideline does advise reading BMI with caution in people aged 65 and over. For ages 2 to 19 there is no fixed range, because a child's BMI is read as a percentile for age and sex; the 5th to below the 85th percentile is healthy weight.
Sources
- WHO: Obesity and overweight (fact sheet) — BMI definition; adult overweight is a BMI of 25 or more, obesity 30 or more (checked October 12, 2026)
- WHO Nutrition Landscape Information System: BMI cut-offs for adults — underweight below 18.5, normal weight 18.5 to 24.9 (checked October 12, 2026)
- CDC: Adult BMI categories — category names and ranges for adults 20 and older, including obesity classes (checked October 12, 2026)
- NHLBI (National Institutes of Health): Calculate your BMI — the same four adult categories (checked October 12, 2026)
- CDC: BMI frequently asked questions — the formula in metric and U.S. units, and what BMI cannot show (checked October 12, 2026)
- CDC: Child and teen BMI categories — percentile categories for ages 2 through 19, including severe obesity (checked October 12, 2026)
- NICE guideline NG246: Identifying and assessing overweight, obesity and central adiposity — waist-to-height bands, lower BMI thresholds for some ethnic backgrounds, caution with BMI in older and muscular adults (checked October 12, 2026)